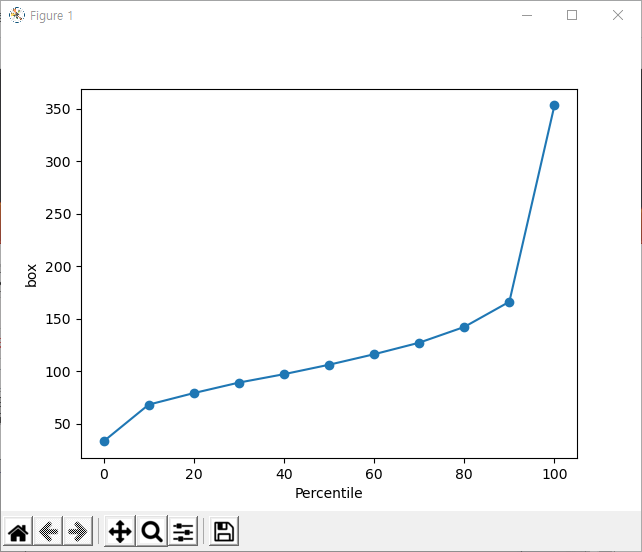
상자깡시 각 쥬얼이 등장할 확률은 c급95% b급 4% a급 1%로 진행하였습니다.
시뮬레이션은 1만번, 백분위는 10%짤라서 표현했고 2만번중 가장 운이 없었던 케이스는 상위 100%에 넣어두었습니다.
##개수는 상자의 개수입니다. 상자 10코인이니까 들어가는 코인은 상자개수*10##
위 과정은 파이썬3.8으로 진행하였고 소스코드는 아래에 적어두겠습니다.
import matplotlib.pyplot as plt
import random
NUMBER_OF_REPEAT = 10000
def open_jbox():
percent = random.randrange(1,101)
if percent <= 95:
return 1
elif percent > 95 and percent <= 99:
return 2
else:
return 3
def manipulation(grade):
percent = random.randrange(1,101)
if grade == 1:
success = 70
if grade == 2:
success = 50
if grade == 3:
success = 30
if percent <= success:
return grade+1
if percent > success:
return grade
def count_jel(jewel_list):
for a in range(1,4):
if jewel_list.count(a) >= 2:
temp = manipulation(a)
jewel_list.remove(a)
jewel_list.remove(a)
jewel_list.append(temp)
def statistics(x_list,num): #누적 통계를 상위 10%단위로 끊어주는코드
x_list.sort()
temp = 1
x_average = []
x_average.append(x_list[0])
while temp<11:
x_average.append(x_list[int((num/10)*temp)-1])
temp = temp+1
return x_average
result_list = []
num = 0
while num<NUMBER_OF_REPEAT:
jewel_list = []
num = num+1
attempt = 0
while True:
attempt = attempt+1
jewel_list.append(open_jbox())
count_jel(jewel_list)
if jewel_list.count(4) == 4:
break
result_list.append(attempt)
x_list = statistics(result_list,NUMBER_OF_REPEAT)
y_list = [0,10,20,30,40,50,60,70,80,90,100]
print(x_list)
plt.xlabel('Percentile')
plt.ylabel('box')
plt.plot(y_list, x_list, marker='o')
plt.show()
 바론과의형제